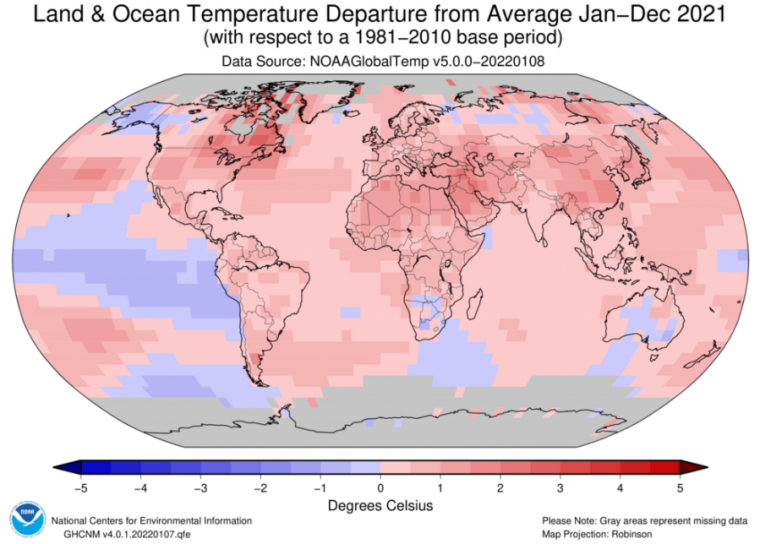
We are still in the midst of running a dangerous experiment on Earth’s climate system, and we get to periodically check in on the results—like laboratory rats peering at the graphs on a whiteboard across the room. And it’s that time again.
Every year, global temperature can be compared to the predictions born of the physics of greenhouse gases. A number of groups around the world maintain global surface temperature datasets. Because of their slightly differing methods for calculating the global average and slightly differing sets of temperature measurements fed into that calculation, these datasets don’t always arrive at exactly the same answer. Lean in close enough and you’ll see differences in the data points, which can translate into differences in their respective rankings of the warmest years. The big picture, on the other hand, looks exactly the same across them.
NASA, NOAA, and the Berkeley Earth group each released their end-of-year data for 2021 today, while the Japanese Meteorological Agency (JMA) and European Centre for Medium-Range Weather Forecasts (ECMWF) numbers were already out. They all came up with similar rankings this year. All but ECMWF placed it as the sixth warmest year on record, while ECMWF ranked it in fifth place. It was very close to 2015 and 2018, so fifth through seventh are roughly tied. What is true for all of the datasets is that the last seven years are the warmest seven years on record.
Read 8 remaining paragraphs | Comments
